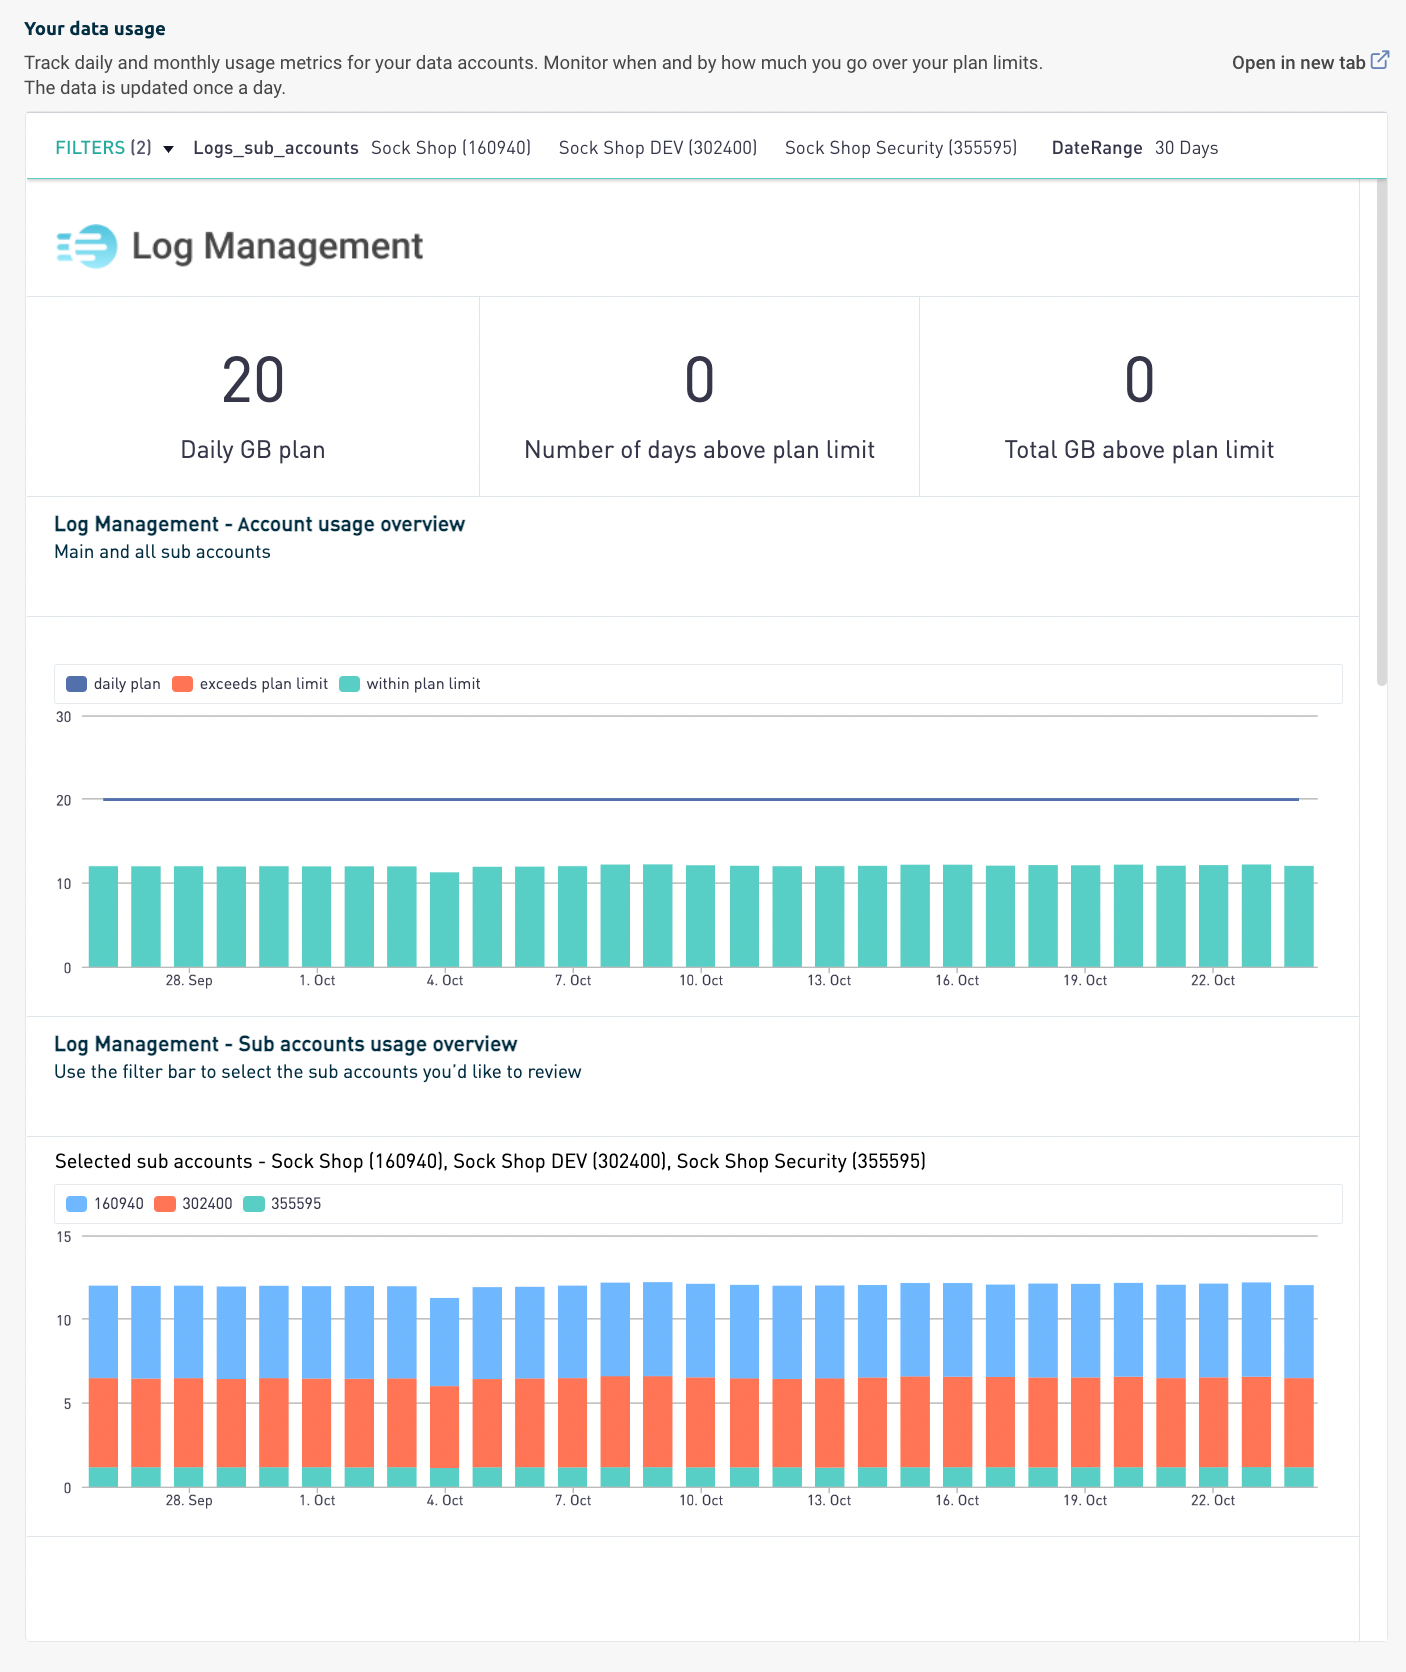
Logz.io provides you with dashboards to easily track your daily and monthly usage. These dashboards let you monitor your overall usage and understand whether you’re about to go over your plan limits.
To access these dashboards, login to your Logz.io account and navigate to Settings > Plan and usage > Usage & Info.
The dashboards on this page represent the different Logz.io products you use: Log Management, Infrastructure Monitoring, and Distributed Tracing.

The default view includes a 30 days overview of your Logs account, and you can change and adjust the filters according to your desired view.
You can apply any of the following filters:
- Date Range - Set a custom range or choose from one of the existing presets.
- Logs sub accounts - Choose which Log accounts/sub accounts you’d like to view.
- Metrics data sources - Choose which Metric accounts/sub accounts you’d like to view.
- Tracing data sources - Choose which Tracing accounts/sub accounts you’d like to view.

The dashboard gives a quick overview of the current daily plan, the number of days you exceeded your plan, and the total GB consumed above the existing plan.
The chart displays the same information, divided into days and accounts. If you choose to view multiple accounts, you’ll be able to differentiate them according to their color. You can hover over the different columns in each chart to get a detailed view of daily GB consumption.

To download your data, hover over the dashboard you’re interested in, click on the top right menu and choose Download data. The .CSV file includes:
- Date
- Account key number
- Account name
- Amount of GB used

Periscope powers these dashboards, and you can view them separately from the Logz.io app by clicking on the Open in a new tab option at the screen’s top right corner.
