Get set and get ready: This section describes what you have to do to get set up - before you can use Distributed Tracing in Logz.io.
If you already use Distributed Tracing, refer to our guides on how to get connected to Logz.io.
This information is also available in the Logz.io Docs, via the My code is instrumented filter.
To set up Distributed Tracing:
Get access to Logz.io
Sign up for a free trial account.
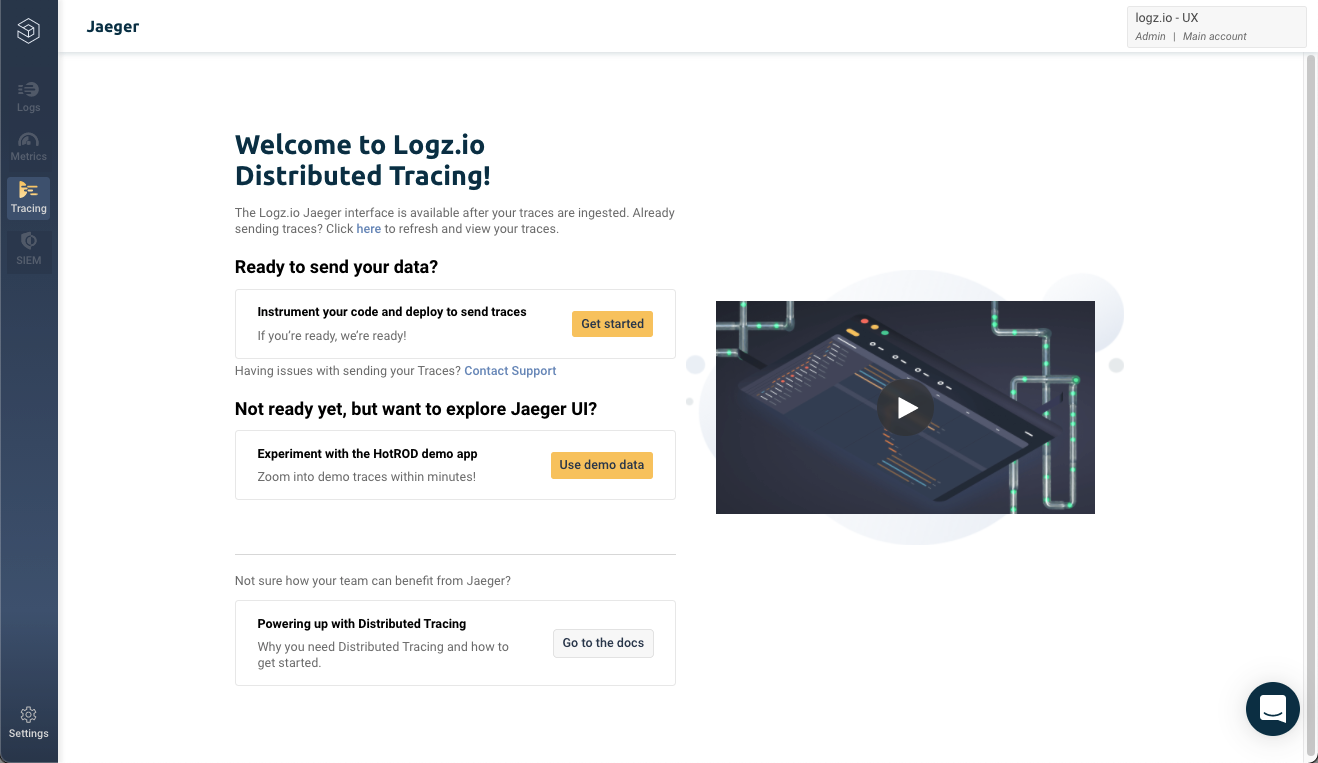
Once you have a Logz.io account, navigate to the Distributed Tracing interface.
Get your credentials to send tracing data
When you configure your system to send tracing data to Logz.io, you need to provide your Logz.io Distributed Tracing token and Region information.
Look up your Tracing token
You must have admin permissions for the Logz.io account to view the Manage tokens page. If you’re not an admin user for the account, consult with an account admin to get the Distributed Tracing token information.
-
From the Tracing menu, go to Manage tokens.

-
Find the Distributed Tracing account you want to ship to in the table, and copy the token.
Related Links
- For information about how to manage your tracing data sources, see the Manage a Distributed Tracing account topic.
Look up your Region information
If you have admin user permissions, you can clarify the 2-letter code for your region here: (Settings) > General settings > Account settings.

The list of all the region codes is available in the Logz.io Docs, in the Region code column of the Regions and Listener Hosts table. The default region is US east.
Set up instrumentation
Application instrumentation starts with selecting the library based on the programming language that you’re using. Logz.io makes the process of collecting data from the software as easy as possible by taking advantage of community-developed plug-ins for the most commonly used libraries and frameworks.
There’s a growing trend to do this for every type of library, software system, infrastructure component, such as proxies and service meshes, and even for orchestration systems, such as Kubernetes itself.
Logz.io’s distributed tracing solution is designed to support a variety of popular open source instrumentation libraries, including OpenTracing, Jaeger, OpenTelemetry, and Zipkin.
But instrumentation doesn’t have to be a huge all-or-nothing effort. It’s not mandatory to immediately instrument ALL the code in your environment to start benefitting from Distributed Tracing: You can ramp up your instrumentation gradually, by implementing on a service-by-service basis.
If you hit a wall, we’ll do our best to provide support to help you solve your instrumentation issues.
To determine the best instrumentation strategy for your system, start with Tracing > Send your traces, and then select the relevant filter in the Tracing tab, depending on whether or not your code is already instrumented: Either My code is instrumented or My code is not instrumented.
This information is also available in the Logz.io Docs, in Send your data > Tracing.
Install and Run the OpenTelemetry Collector
Logz.io captures end-to-end distributed transactions from your applications and infrastructure with trace spans sent directly to Logz.io via the OpenTelemetry collector, which you install inside your environment.
We recommend that you use the OpenTelemetry collector to gather trace transaction data from your system. With the merging of the OpenTracing and OpenCensus projects, OpenTelemetry is the CNCF standard.
This link takes you to the OpenTelemetry installation. The information is also available in the Logz.io Docs, in Ship your data > OpenTelemetry installation.
If you’re deploying distributed tracing on Kubernetes, we recommend the Kubernetes deployment reference topic.
For additional insights, check out our Guide to OpenTelemetry!