Some incidents are best detected by a sequence of logs, which may involve different log types, log fields, or even accounts.
For example: a deployment on a particular microservice, coinciding with an error on another environment. In this case, 2 separate events can be correlated to trigger an alert.
Correlated alerts are instrumental for reducing false-positives. By defining a more specific use case that contains 2 scenarios, the trigger can be more sensitive and reduce unwanted noise.
Configuring a correlated alert
To correlate events, we need to configure 2 search queries, each with its own trigger condition. For the alert to trigger, both conditions must be satisfied.
If you opt to join the queries, you must also select aggregation criteria and fields to join. When the queries are joined, the values of the join fields must match for the alert to trigger.
This tutorial assumes you are familiar with the process of configuring a single-query alert. It explains what’s different when correlating queries.
- Name the alert
- Add another query
- Query 1 & Query 2
- Joining the queries (optional)
- Trigger conditions
- Notification description
- Configure output per query
- Save it!
- Investigating correlated alerts
Name the alert
The name should convey the significance of the combined event for both queries together.
For example, “Brute-force attack from malicious address followed by malware download”.
Add another query
Click + Add another query to add the option to correlate queries.
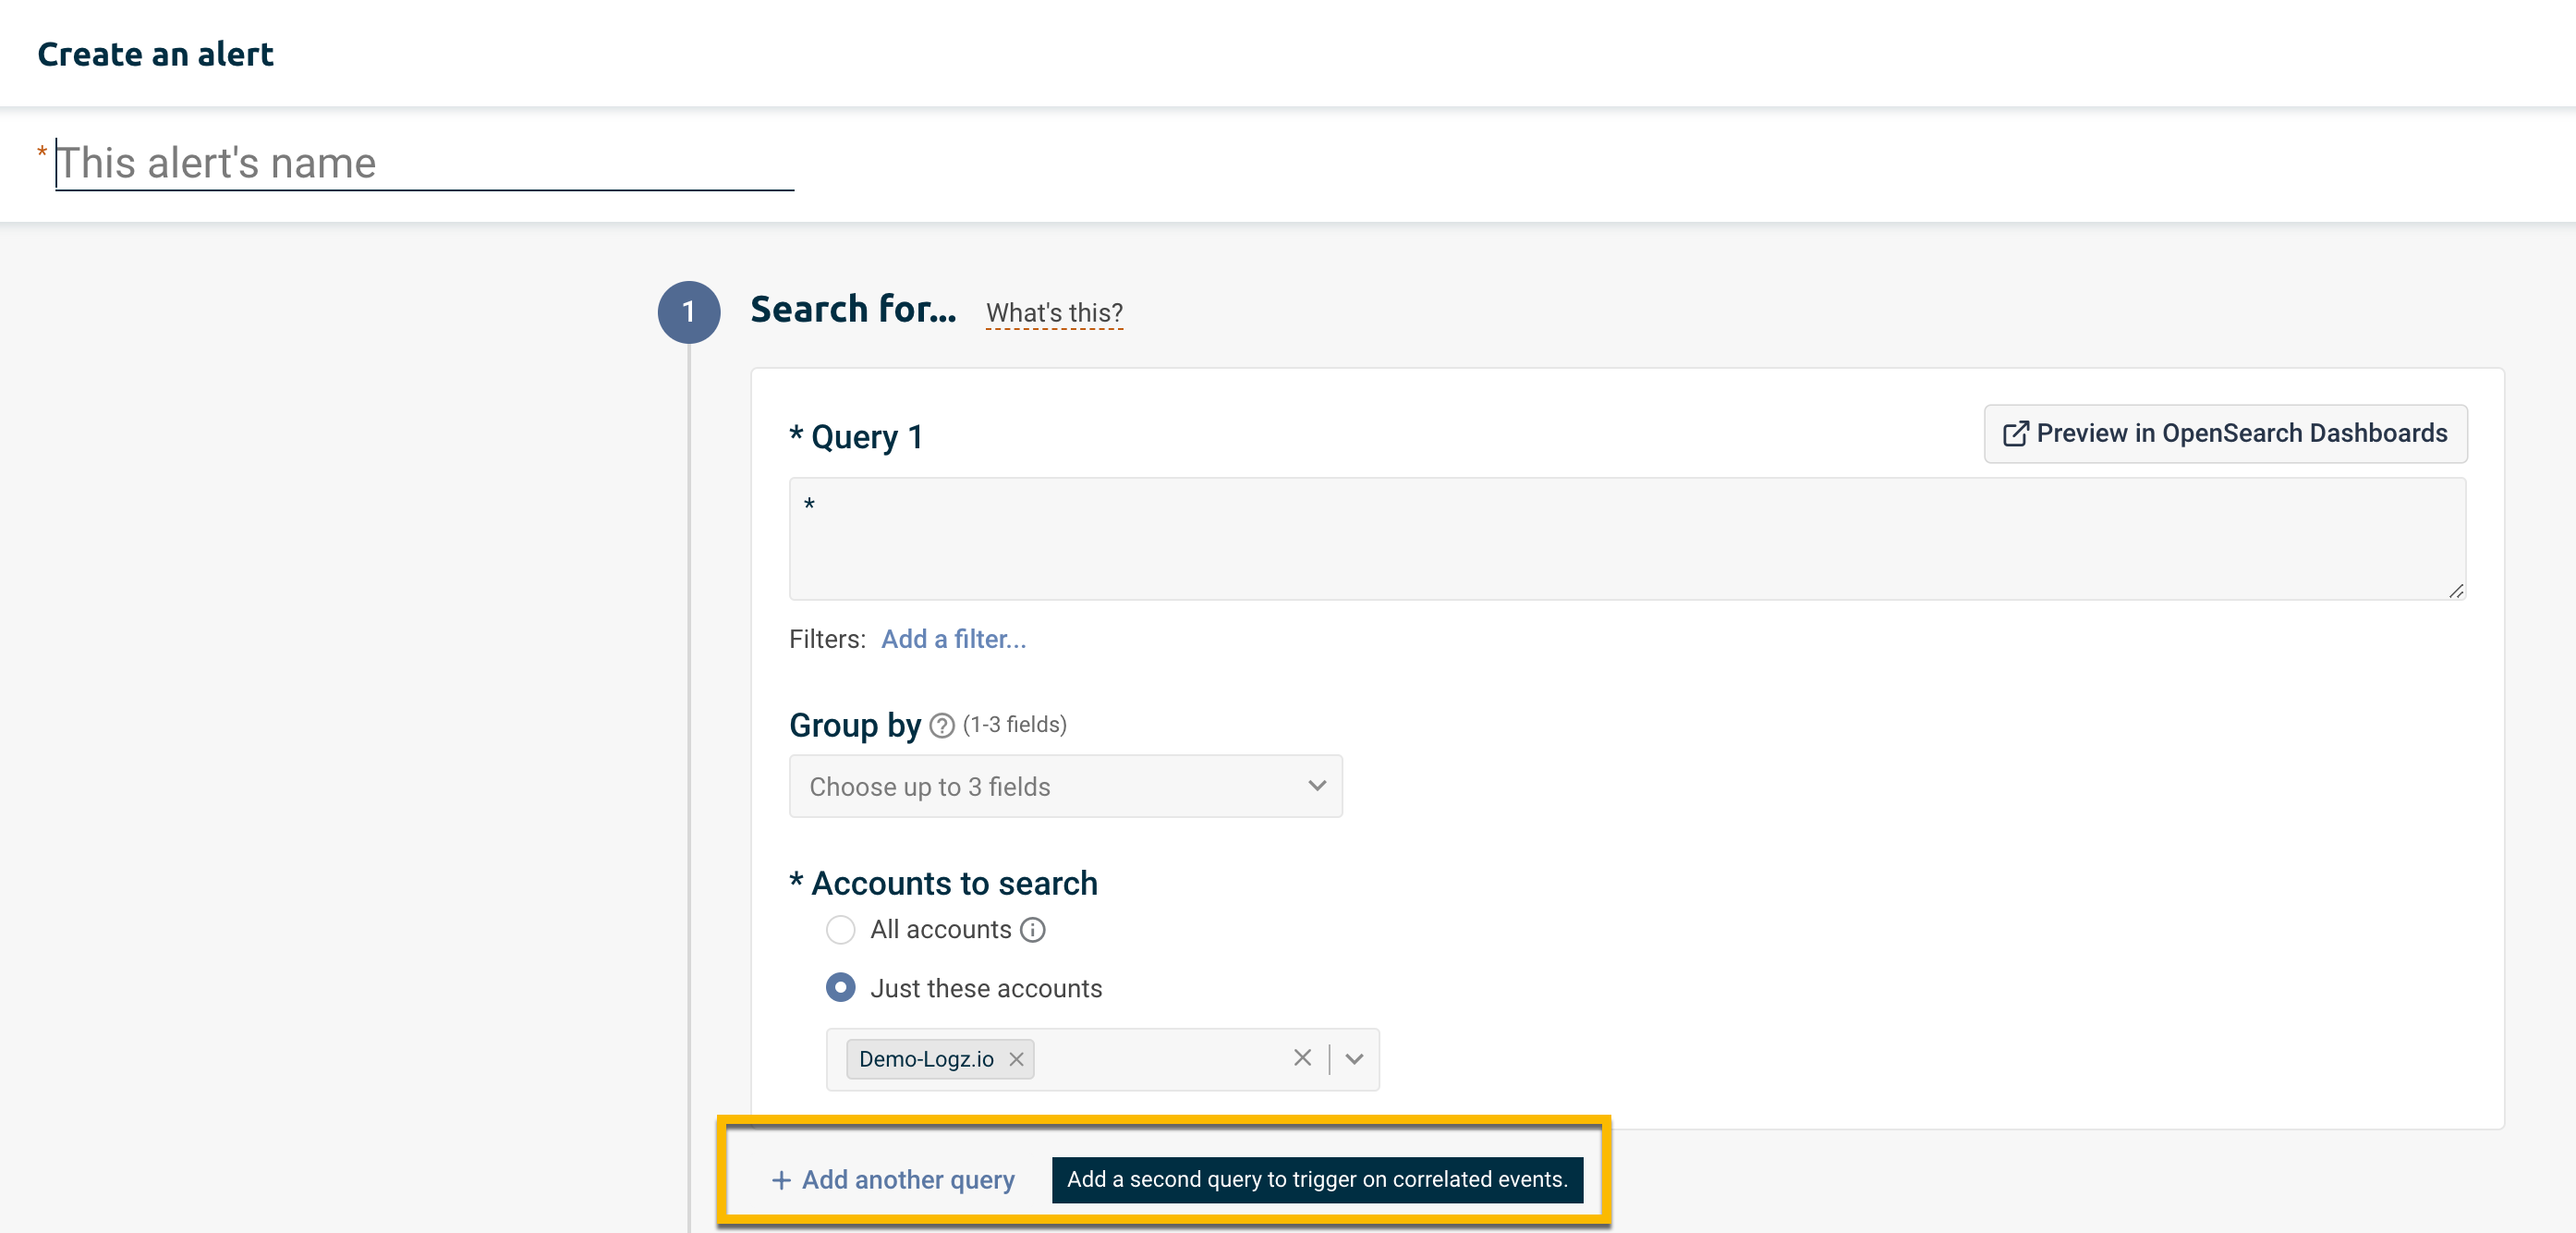
Query 1 & Query 2
The form now has 2 sections: Query 1 & Query 2.
There is no significance to their order. If Query 1 and Query 2 are interchanged, the results will be the same.
The following criteria are similar for both the single-query and multi-query alert:
- Fill in the free search and filtering criteria as usual.
- If you are only using filters, leave a wildcard asterisk (*) in the free search box.
- You have the option to aggregate results for as many as 3 fields. Select group by fields from the dropdown list.
- Select the Accounts to search.
- You can preview the results in OpenSearch Dashboards for each query independently. Click Preview in OpenSearch Dashboards to open the results for the past 24 hours in another tab.
- If you change your mind, you can delete either of the queries. Click X Delete query to return to a single-query form.

Joining the queries (optional)
If you opt to join the queries, you must first add group by fields that will aggregate results by values. When the queries are joined, the values of the join fields must match for the alert to trigger.
- First, select the group by fields for each of the queries.
- You can select as many as 3 fields.
- The number of group by fields can differ between the queries.
-
Group by fields provide criteria for count aggregations.
As a result, the alert will count the query results returned per value of the group by field. This allows you to join the results by searching for overlapping values that are the same for the join field pairs.
Grouped fields limitation: You cannot use the group by feature on analyzed fields (Text data type).
-
Select the join pairs you want to enable. You can enable as many as 3 pairs.
Available join options are automatically determined by the order of your group by fields. The suggestions are ordered pairs of the group by ields.
You do not have to join all of the group by fields, and the queries can have a different number of group by fields.

When joined, the alert looks for values that are common to the field pairs selected for joining the queries. This means the alert will only trigger if it finds matching values for the join field pairs.

Joined fields are indicated by the link icon .
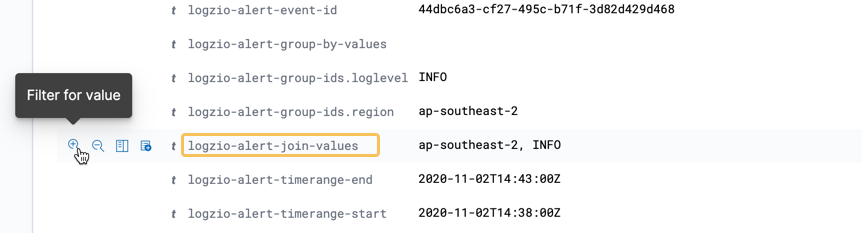
When the alert triggers, the event log will specify the matching values that triggered the alert in the field logzio-alert-join-values.
For example, if we enable 2 joins: by the fields hostname and then IP address, the field logzio-alert-join-values will contain comma-separated pairs, such as Host1, 247.23.11.58, Host2, 44.76.131.4.
Trigger conditions
When the alert has 2 queries, you can set a single condition for each of your queries, and a single severity.
As usual, each query can take a different condition for a field of your choice.

The alert conditions are evaluated over regular intervals. The time frame for evaluating the conditions is the same for both queries. It can range between a minimum of 5 minutes and a maximum of 24 hours/1 day.
Notification description
It’s a good idea to add a description that works for both queries and what they capture together. As usual, best practice is to include a playbook that covers the steps needed to investigate and remediate the incident.
Configure output per query
You have the option to send notification sample data in JSON or Table format. Toggle the button to select your preferred format.
Next, select the output fields for each query, as applicable. As usual, if the query has aggregations (or group-by fields) definted, the output will be auto-selected, and the aggregated results will be sent by default. Otherwise, you can select which fields to include. Learn more.

Save it!
Click Save at the top of the form to save your alert.
Investigating correlated alerts
The best way to begin investigating a correlated event, is to click the link View in OpenSearch Dashboards in the notification.
Alternatively, you can visit the alerts Event Management page and click the button Investigate next to the relevant event.
When a correlated alert triggers, it writes 2 event logs - 1 per query. The event logs will be numbered 1/2 and 2/2, respectively. Each event log will have its own Investigate drilldown link.
The group-by fields used in the alert will be toggled into the table by default.
If the queries are joined, you can filter for the matching join values. Expand the event log to reveal the full list of fields. Hover over the field logzio-alert-join-values and click to filter for its value.