You can import your existing dashboards to Logz.io via a bulk process (using a Python script) or via a manual process.
Importing multiple dashboards via script
To enable easy migration, we created a Python script to bulk upload your Grafana dashboards to our platform.
Notes
- Bulk import is supported for Grafana version 6 and above.
- Dashboards that include annotations, notification endpoints, and other external resources are imported without these resources during bulk import.
- Custom selection of dashboards is not possible with bulk import. All of your dashboard folders are imported to a single folder within Logz.io.
- Grafana dashboards with schema version 14 or lower that include “row” objects are not added: You will receive a warning in the logs. We recommend that you update your dashboards to the latest version.
- The
p8s_logzio_namevariable is not added to panel queries that don’t include filtering: You will receive a warning in the logs. - Some panel types are not supported by the Logz.io platform. If your dashboard includes an unsupported panel type, you will receive a warning in the logs. You may experience some issues when the panel renders in Logz.io.
Bulk dashboard import procedure
From your Terminal, perform the following steps:
Clone the repository.
Use the following command to clone the repo:
git clone https://github.com/logzio/grafana-dashboard-migration-tool.git
Switch directory.
Use the following command to switch to the repo directory:
cd grafana-dashboard-migration-tool
Install poetry and dependencies
pip install poetry
poetry install
Run the script and configure environment variables.
Run the script:
GRAFANA_TOKEN="XXXXXXXXXXXXXXXXX" \
GRAFANA_PROTO="http" \
GRAFANA_HOST="grafana.example.com" \
REGION_CODE="us" \
LOGZIO_API_TOKEN="XXXXXXXXXXXXXXXXX" \
poetry run python main.py
Configure or export the enviroment variables as follows:
| Enviroment variable | Description |
|---|---|
| GRAFANA_HOST | Your Grafana host without protocol specification (for example, localhost:3000) |
| GRAFANA_TOKEN | Your Grafana editor/admin API key: Find or create one under Configuration > API keys |
| LOGZIO_API_TOKEN | Your Logz.io account API token: You can find the API token under Settings > Manage tokens > API tokens. |
| REGION_CODE | Your Logz.io region code: You can look up your region code here For example, if your region is US, then your region code is us |
| GRAFANA_PROTO | Protocol to access your grafana instance. Defaults to https. |
View dashboards
In your Logz.io metrics account, check your Uploaded by script folder to see all dashboards.
For the dashboard import to work smoothly, you’ll need to change the name of the data source in your JSON file to the name of your Logz.io Metrics account.
Your Metrics account information is located in the Manage Accounts ( > Settings > Manage accounts) page of your Operations workspace. 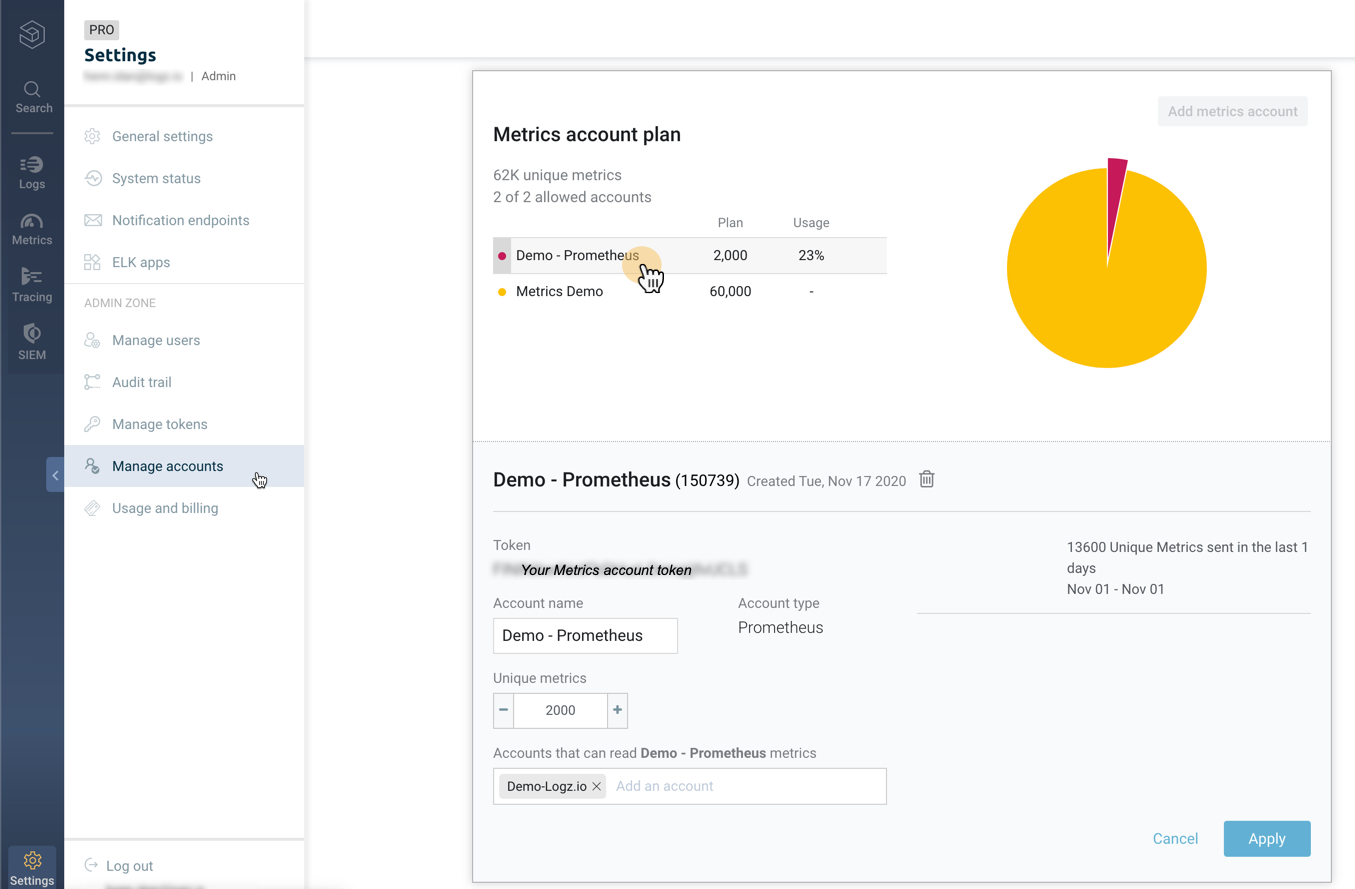
For the record, notification endpoints and dashboard annotations are not imported: You’ll need to recreate them in Logz.io. See Notification endpoints and Annotations for more information.
Importing individual dashboards
To import individual dashboards:
Navigate to the Metrics tab.
Log into Logz.io and navigate to the Metrics tab.
Select the Import option.
In the left navigation pane, click and select Import.

-
To import your existing Prometheus dashboards, first export the relevant dashboards as JSON files, then click Upload JSON file and select the files to upload.
For related information see Upload JSON logs.
Overview
This tool allows you to migrate Grafana dashboards based on InfluxDB source to Prometheus source (e.g., Prometheus, M3DB, Cortex).
The tool functions in two ways:
- Translate the query language from InfluxQL to PromQL.
- Search and replace metrics names.
Convert Grafana Dashboards from InfluxQL to PromQL
Before you begin, you’ll need:
- InfluxQL metrics
- Logz.io account
Clone the converter repository
Git clone https://github.com/logzio/influxql-to-m3-dashboard-converter.git
Install the tool requirements
Navigate to the project folder and install the requirements by running:
pip install -r requirements.txt
Configure the requirements
Open the config.yaml, and edit the configuration as in the example below. For further examples, refer to the GitHub repository of this project.
log_level: # optional default is INFO
datasource: # optional - will be used as the new datasource
importer:      # required - at least 1.
  grafana:  # grafana api url i.e: https://<<username>>.grafana.net for grafana cloud url
    endpoint:
    api_token:
  folder:
    path:  # relative or full path
processor:
  replace_metrics_names:
    - name: # metric to be replaced
      value: # new metric name
  find_metrics_names:
    metrics_auth: # Currently only prometheus is supported
      metrics_db_endpoint: https://api.logz.io/v1/metrics/prometheus/api/v1
      metrics_basic_auth:
        username:
        password:
      metrics_oauth_header:
        key: X-API-TOKEN
        value: <<PROMETHEUS-METRICS-SHIPPING-TOKEN>>
    replace_strategy:
      strategies: [ 'statistic_combination' , 'permutation' ] # optional
      min_match_percent:  # min percent for result match 1-100
      min_filter_percent:  # threshold for combination matching 1-100
exporter:
  grafana:
    endpoint: https://api.logz.io/v1/grafana/api
    auth_header:
      key:
      value:
  folder:
    path: # relative or full path
Configure the parmeters as per the table below and save the changes.
| Parameter | Description |
|---|---|
| log_level | Optional. Log level to be used during the run of the program. Default: INFO |
| datasource | Optional. Replaces the existing datasource in the dashboard |
| importer | Required. At least one input element |
| importer.grafana | Optional. Import influxql dashboards from grafana API |
| importer.grafana.endpoint | Required. Grafana API URL |
| importer.grafana.token | Required. Grafana API token |
| importer.folder | Optional: Import influxql dashboards from a folder |
| importer.folder.path | Required. Path to the folder which contains influxql dashboards. (Relative or absolute) |
| processor | Optional. Processor modules that can transform output |
| processor.replace_metrics_names | Optional. A processor that will replace a metric name |
| processor.replace_metrics_names.name | Required. The name of the original metric to be replaced |
| processor.replace_metrics_names.value | Required. The new metric name |
| processor.find_metrics_names | Optional. Processor to find a match between existing and available metrics |
| processor.find_metrics_names.metrics_auth.metrics_db_endpoint | Required. API endpoint of the metrics db. Currently only prometheus is supported. |
| processor.find_metrics_names.metrics_auth.metrics_basic_auth.username | Optional. Metrics db username to be used when querying the db API. |
| processor.find_metrics_names.metrics_auth.metrics_basic_auth.password | Optional. Metrics db password to be used when querying the db API. |
| processor.find_metrics_names.metrics_auth.metrics_oauth_header.key | Optional. Metrics db oauth header key to be used when querying the db API. Must be a full header key |
| processor.find_metrics_names.metrics_auth.metrics_oauth_header.value | Optional. Metrics db oauth header value to be used when querying the db API. Must be a full header value, including your token for shipping metrics to your Logz.io account. Find it under Settings > Manage accounts. How do I look up my Metrics account token? |
| processor.find_metrics_names.replace_strategy.strategies | Required. Strategies to be used in the processor. Available strategies: permutation,statistic_match |
| processor.find_metrics_names.replace_strategy.min_match_percent | Required (for statistic_match strategy). The percent threshold for considering a match between two metrics. |
| processor.find_metrics_names.replace_strategy.min_filter_percent | Required (for statistic_match strategy). The percent threshold for performing combination match between two metrics. |
| exporter | Required. Exporter module that will export the converted dashboards. |
| exporter.grafana | Optional. Export dashboards using grafana API. |
| exporter.grafana.endpoint | Required. grafana API URL. |
| exporter.grafana.auth_header.key | Required. Authentication header key. |
| exporter.grafana.auth_header.value | Required. Authentication header value. |
| exporter.folder | Optional. Export dashboard to a folder. |
| exporter.folder.path | Required. Path to the folder in which the dashboards will be exported. (Relative or absolute) |
Run the script
pip install -r requirements.txt && python3 main.py
Check Logz.io for your dashboards
Once the conversion has been completed, log in to your Logz.io Metrics account, and open the Logz.io Dashboards tab.